shmooPLOT
Single and multi-dimensional condition analysis.
Shmoo plots are routinely used by development and test engineers to evaluate digital devices under pattern test while one or more conditions are being varied. But for shmoo analysis of devices such as microprocessors, the amount of data that must be collected and analyzed to effectively evaluate results can mean days or weeks of work. Historically, the problem of assembling the vast amounts of shmoo data into a useful form has been compounded by the lack of a specialized shmoo analysis tool to manage and evaluate the data.
IDS offers shmooPLOT, the industry's only solution that provides both a specialized interface for database access of shmoo data, and a comprehensive set of analysis functions. shmooPLOT provides a powerful means of handling shmoo test data, dynamic analysis and charting functions, and gives you unique perspectives on condition analysis. shmooPLOT generates analysis reports for both one-dimensional (line shmoo), and multi-dimensional (e.g. 2D, 3D) shmoo datalogs.
With the IDS shmooPLOT tool, you can easily access the data you need to generate shmoo analysis charts such as:
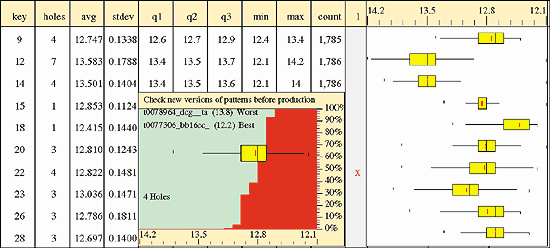
- li>Boxplot per Line Shmoo - a one-dimensional, pattern-based line shmoo chart with boxplots displaying the distribution of first-fail or last-pass locations.
- Per Pattern Statistics - composite per pattern statistics on all selected characterization logs, displaying best case, worst case, average, median, and range.
- Pin Pareto - a pin-by-pin bar graph representing the number of times each pin fails for single or composite characterization logs.
- Pattern Pareto - a single or composite pattern pareto representing all failing patterns or only contour (first fail) patterns.
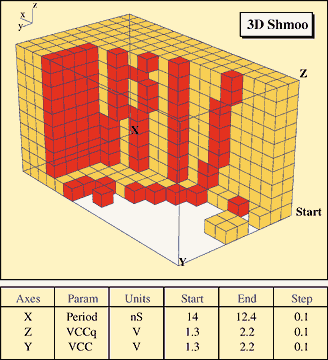
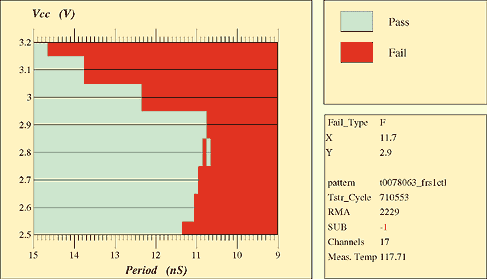
- 2D/3D Shmoo - single or composite multi-dimensional shmooplot displaying the device pass/fail regions for all swept conditions as a two- or three-dimensional shmooplot. All plot types are fully interactive. Fail pattern I.D., tester cycle, relative memory address, fail pins, temperature - can all be displayed for any fail point.
3-D shmooPlot
Display of the device pass/fail regions as three parameters are swept (varied) over a defined range. Fist fail points are highlighted.

Bosplot per Line Shmoo
Display first-fail or last-pass statistics per line shmoo as well as a contour plot showing the cumulative percentage of patterns failing at each parameter step.

2-D Shmoo
Show the pass/fail regions for single or composite characterizations when two parameters are varied. The information describing each point of failure can also be shown.

IDS Software Systems, 3 Waters Park Drive, Suite 222, P.O. Box 6936, San Mateo, CA 94403. Tel: 650-349-0500; Fax: 650-349-0101.
