
Authors:
Movellus & Siemens EDA - Henrique Mendes, Product Engineer, Tessent Embedded Analytics & Robert Wilcox, Product Engineer, Tessent Embedded Analytics
Detect, diagnose, and debug using sensors and functional monitoring
Modern AI workloads drive an extremely "spiky" power profile where current demands surge to hundreds of Amps within nanoseconds, clashing with the tighter operating ranges of advanced process nodes as they push below 0.8V. This creates a physical bottleneck: the on-die power delivery network (PDN) cannot sustain the instantaneous current required by complex AI workloads, effectively capping computational throughput. Consequently, performance is no longer limited by transistor switching speeds but by the instability of the voltage supply under the stress of high-coincidence-matrix operations.
The scale of this challenge has grown considerably. Rack-level power density has increased from a few kilowatts in traditional enterprise deployments and is quickly growing towards over 100kW in modern AI-optimized configurations. GPU-based AI accelerators cycle through millisecond-scale execution phases — prefill (loading and processing the input prompt), decode (generating each output token), and idle — each with distinct performance, thermal, and power characteristics. These transitions produce load transients with low inertia, significant surges and dips, and a high peak-to-idle ratio that conventional power delivery infrastructure was not designed to handle.
Planning for these workloads is extremely difficult because they are transient (both instructional and data-dependent), often manifesting only as intermittent functional failures or throughput degradation that evades standard verification, characterization, and system-level testing methodologies. Because the relationship between instruction sequences, data patterns, and voltage is unpredictable, these failures are nearly impossible to observe or model with legacy tools. This forces chip and system designers into a costly trade-off: accept efficiency losses from excessive guard banding — the voltage safety margin added at design time to absorb worst-case transients — or face the risk of undetected errors at scale. With multi-hundred-billion-dollar investment flowing into AI-centric datacentres over the coming years, having the ability to observe and correlate physical PDN changes with functional behavior is essential at fleet scale.
Achieving this requires two capabilities working in concert: visibility into on-chip workload behavior, and real-time voltage telemetry at the transistor level.
Siemens Tessent Embedded Analytics addresses the first, and Movellus Aeonic Insight the second.
Functional and Physical Monitors
Siemens EDA Tessent Embedded Analytics provides a suite of functional monitors that observe on-chip behavior without interrupting normal device operation. The monitors capture workload activity at the core and interconnect level and can be configured to focus on specific conditions — filtering trace data to what is relevant for a given workload. A key capability is cross-triggering: the monitors can record a window of activity both before and after a trigger event occurs, giving engineers the context needed to understand what led to a failure or performance anomaly. What functional data alone cannot capture is the voltage behavior driving those anomalies — that requires direct measurement at the transistor level.
Movellus Aeonic Insight Droop Detector monitors on-die voltage continuously and generates a hardware trigger when voltage crosses a programmed threshold. Telemetry from the detector such as voltage levels and edge analytics including watermark values and averaging is readable in real time, making it possible to correlate voltage events directly with the workload conditions that caused them.
Demo: Droop Detector triggering Embedded Analytics system
Siemens and Movellus built a demonstration system on a AMD Zynq™ UltraScale+™ (Figure 1) in which two RISC-V cores run the target workload, with Tessent Embedded Analytics Bus Monitor monitoring transaction traffic across the SoC interconnect, and Movellus Droop Detector IP monitoring the on-die voltage using the Tessent Embedded Analytics Status Monitor. When the Droop Detector senses a voltage transient crossing a programmed threshold, it fires a hardware trigger to the Embedded Analytics infrastructure — which captures a snapshot of both core execution state and interconnect activity at the moment the voltage event occurred.
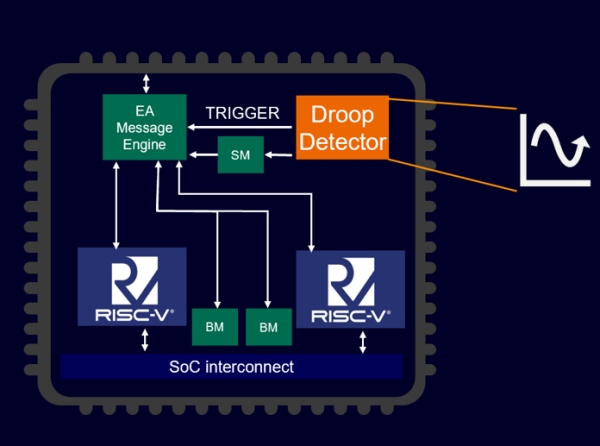
Figure 1: FPGA demo - RISC-V cores and Droop Detector connected to EA infrastructure, including Status Monitor (SM) and Bus Monitor (BM)
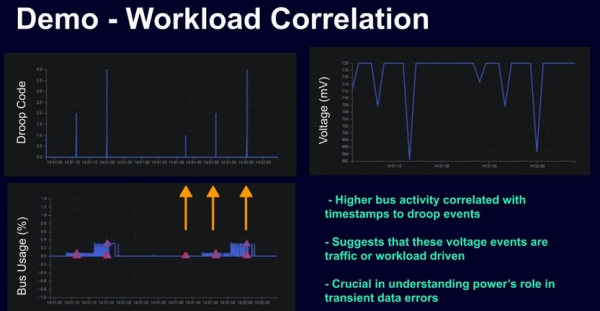
Figure 2: Voltage event correlated with workload
Figure 2 shows time-aligned traces of workload activity (bus usage) and on-die voltage — the two data streams the demo captures simultaneously. The voltage droops correspond directly to peaks in workload intensity, with each threshold crossing marking the moment the Embedded Analytics snapshot starts collecting data This time-aligned view is what transforms raw telemetry into a diagnostic tool: rather than knowing only that voltage stress occurred, engineers can see precisely which workload conditions drove it, where it occurred, and at what severity. At scale, that specificity is the difference between applying guard bands uniformly and calibrating them to the conditions that actually matter.
In Conclusion
When on-chip functional observability and real-time voltage telemetry work in concert, the relationship between workload behavior and PDN stress becomes traceable rather than inferred. For chip designers, this means calibrating guard bands to the specific instruction sequences and workload conditions that drive voltage excursions — not to worst-case assumptions. For fleet operators, it means telemetry granular enough to make workload decisions grounded in measured PDN data. Together, that translates into tighter operating margins, reduced efficiency losses, and AI infrastructure optimized to run closer to its physical limits.
Learn More
For more information on Tessent Embedded Analytics solutions from Siemens EDA, please visit www.siemens.com/Tessent-Embedded-Analytics