By Rajeev Thaware, Gouri Patil and Saurabh Joshi (eInfochips)
Abstract
Traffic management plays an important role in city planning and regulating the density of vehicles on the road. For effective traffic management, vehicle classification and vehicle counting are the key modules that serve as a base for almost all the use cases built for traffic analysis. Classification and counting of vehicles, both moving and stationary, are done by applying image processing (video content analysis) algorithms on video streams taken from a stationary camera.
This white paper proposes an effective approach for moving vehicle classification followed up by vehicle counting, for classified types of vehicles. This data helps in strategic city planning, and in generating meaningful insights for improving efficiency and reliability in Traffic Management.
Introduction to Traffic Management
The increased demand for smart cities, from both developed and developing nations, necessitates the deployment of digital techniques to analyze the road traffic density, especially in mega cities, for effective traffic management and formulating an intelligent transportation system. Video surveillance is one of the most widely adopted technologies by the city authorities for traffic monitoring.
It is estimated that the video surveillance market will to grow from USD 36.89 Billion in 2018 to USD 68.34 Billion by 2023, growing at a CAGR of 13.1% between 2018 and 2023, according to MarketsandMarkets. Traffic Management Market will be worth 59.48 Billion USD by 2022.
Video management and analytics are set to be in a sweet spot for enabling effective traffic management solutions in smart city projects.
Traffic Management Use Cases
When it comes to effective traffic management, here are typical use cases that need to be addressed:
- A traffic management application should be able to count the number of vehicles that enter and exit a particular area or present within a specified region of interest.
- It should also be able to identify and count a particular class of vehicle (e.g. Truck, Car, andScooter) passing from the camera's field of view.
The above user stories generate a lot of data that can be leveraged in the following application areas:
- Heat map per vehicle type can help understand the distribution of the types of vehicles and their density on particular roads, which further helps in planning road network as well as active maintenance of the roads in terms of tracking and fixing the wear and tear and more.
- Vehicle flow management and congestion avoidance on the road can be done by applying fluid mechanics principles using the flow volume and flow velocity for a different class of vehicles.
- Diversion planning can be done at peak hours on a daily, monthly or yearly event basis.
- Accidents can be avoided and a systematic, safer, and smarter transit can be achieved by monitoring the driving behavior through video surveillance. The solution can also be then linked with systems from government agencies, like central law enforcement, and customized to work in conjunction with other technologies, like face recognition, automatic license plate recognition, etc.
How do Vehicle Classification and Counting Work?
In the vehicle classification and counting solution, the vehicle is first classified, then counting is done according to the vehicle type. Typically, object detection and tracking for vehicle classification are done using two methodologies:
Methodologies for classification of vehicles:
The work was carried out with the following two approaches:
- HOG-SVM based Vehicle Classification
- MobileNet SSD-based Vehicle Classification
1. HOG-SVM-based Vehicle Classification:
1. What is Support Vector Machine (SVM)?
Support Vector Machine is a supervised machine learning algorithm, which is used for image classification and pattern recognition. An SVM model can be considered as a point space wherein multiple classes are isolated using hyperplanes. (Support vector machine is basically a hyperplane which separates and classify multiple classes very well). The SVM algorithm is widely used for object-based classification.
2. What is Histogram of Oriented Gradients (HOG)?
Histogram of oriented gradients is a feature descriptor used in image processing for object detection through their shapes.
How does it work?
- Divide the image into sub-images called “Cells”
- Compute the gradients in the cells to be described
- Accumulate a histogram within that each cell
- Group the cells into large blocks
- Normalize each block
- Train classifier to detect objects
HOG SVM based vehicle classification consists of three phases:
- Dataset collection
- Feature extraction and
- Training
Dataset Collection:
Data collection plays the most important role in vehicle classification. Data collection for the mentioned application is achieved with the help of free datasets available on the World Wide Web. The dataset is a collection of sample images of vehicles in different positions, illumination conditions, and scales. The dataset should accommodate/account for all detection conditions for which detection/classification needs to be applied. The accuracy depends on the dataset sample images used for training different types of vehicles. In the current application, we have collected three different types of vehicles sample images. For car vehicle type, we have collected Front, Rare, and Side view images. Likewise, it is done for all other types. Used vehicle dataset mostly includes vehicle images from Indian roads.
Feature extraction:
Feature extraction techniques are used to solve common computer-vision problems like object detection and recognition. Histogram of oriented gradients (HOG) is one of the feature extraction techniques used for object detection. In the current vehicle classification and counting application, HOG is used for feature extraction on a labeled training set of images.
A HOG relies on the property of objects within an image to process the distribution of intensity gradients or edge directions. Gradients are calculated within an image per block. A block is considered as a pixel grid in which gradients are constituted from the magnitude and direction of change in the intensities of the pixel within the block.
For computing HOG features, we can specify win_size, block_size, block_stride, cell_size, and nbins. For vehicle classification, we have used the following parameters:
Parameters:
- win_size – Size (128, 128). Detection window size. Align the block size and block stride.
- block_size – Size (16, 16). Block size in pixels. Align the cell size. Only (16,16) is supported for now.
- block_stride – Size (8, 8). Block stride. It must be a multiple of cell size.
- cell_size – Size (8, 8). Cell size. Only (8, 8) is supported for now.
- Nbins – 9. Number of bins.
In the current example, we have used multiclass SVM having three different vehicle models that are Car, HMV (Heavy Moving Vehicles), and two-wheelers. From that, we have trained a classifier with the set of positive-vehicle and negative non-vehicle images for each type.
All the sample images of a vehicle are fed to the feature descriptor extraction algorithm i.e. HOG. The descriptors are gradient vectors generated per pixel of the image. The gradient for each pixel consists of magnitude and direction, calculated using the following formulae:
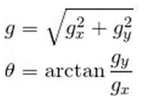
In the above equation, Gx and Gy are respectively the horizontal and vertical components of the change in the pixel intensity. A window size of 128 x 128 is used for vehicle images since it matches the general aspect ratio of the vehicle object. The descriptors are calculated over blocks of pixels with 8 x 8 dimensions. These descriptor values for each pixel over 8 x 8 blocks are quantized into 9 bins, where each bin represents a directional angle of gradient and value in that bin, which is the summation of the magnitudes of all pixels with the same angle. Further, the histogram is then normalized over a 16 x 16 block size, which means four blocks of 8 x 8 are normalized together to minimize the light conditions. This mechanism mitigates the accuracy drop due to the change in light. The SVM model is trained using a number of HOG vectors for multiple vehicles.
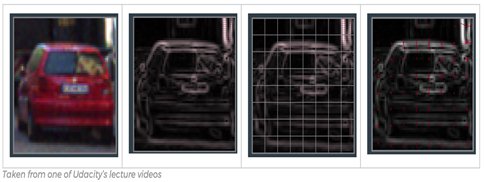
Fig [1]: HOG feature extraction sample (Source: towardsdatascience.com)
Training:
Vehicle classification is based on the training of the collected data set. For the current application, the training is performed on images that are taken from the internet, and wherever needed, supplemented with few capture sequences of our own. A training set of feature vectors is exported from the HOG algorithm and then used for training the SVM model.
In this Vehicle Classification, for three different vehicle types, we have three different Binary Linear SVM models -- 1. For car vehicle type, there is a Car SVM model, 2. For HMV (truck, bus) type, there is an HMV SVM model, 3. For two-wheelers, there is a two-wheeler SVM model.

Fig [2]: Block diagram for Vehicle Training
In this classification, three different sets of binary SVM classifiers are trained to be able to separate each class from all the others, which will generate three different SVM models for each type.
For example, a Car SVM classifier has one positive class having positive sample images of the car and the second one has a negative class having all the other negative images except the car. The same is done for the HMV vehicle class model and for two-wheeler vehicle class model. From the training process, it generates three SVM models as mentioned above.
Vehicle Classification:
Vehicle Classification is done by classifying the vehicles into three types: Car, HMV, and two-wheeler. To classify the vehicle obtained, a vector of HOG features of the vehicle is extracted. This vector is then used in the SVM model to determine a matching score for the input vector with each of the labels. The SVM returns the label with the maximum score, which represents the confidence to the closest match within the trained vehicle data.
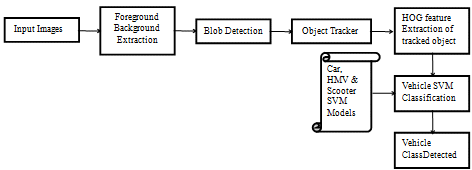
Fig [3]: Block diagram of the vehicle classification process
Vehicle counting is done as follows:
The moving objects foreground masks are first extracted from the foreground background subtraction technique. After the foreground background subtraction, morphological operations are applied to get the close contours to identify blobs. Once the blobs are identified, object enrolling is done. Object enrolment and maintaining of the confirmed and unconfirmed list of objects are done in the object management module. After enrolling of the object, tracking and prediction of the object positions are carried out. Using these tracked objects, vehicle counting is carried out.
Once an object is detected and identified, the object in a video feed/sequence is tracked. To predict the object positions, the Kalman tracking algorithm is used. Classification task is accomplished using an SVM model, which returns the predicted class label on the basis of the trained support vector machine (SVM) classification model. This model also returns a score matrix to indicate the label coming from a particular class. For each observation, the maximum score among all the class models corresponds to the predicted class label and respective experimental vehicle class results are presented on the system.
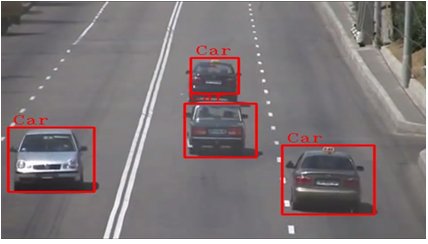
Fig [4]: Vehicle classification result (Source: eInfochips)
(Fig 4 Displaying the vehicle classification result using HOG-SVM classifier)
2. MobileNet SSD-based Vehicle Classification
MobileNet-SSD object detection pipeline comprises of two frameworks, MobileNet (Howard et al., 2017) architecture and SSD (Single Shot multi-box detector) (Liu et al., 2015).
For the application to have a reduced footprint on the compute cost and lesser dependency on the available server resources, MobileNet can be considered, as it is more efficient than any other existing network architecture. SSD is a state of the art object detection framework, using a deep neural network, which predicts multiple bounding boxes for different object categories. The recipe of both MobileNet and SSD gives a very fast and efficient deep learning-based object detection method.
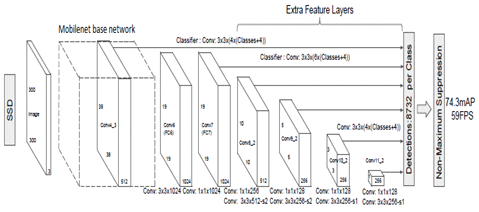
Fig [5]: MobileNet SSD (Ref- https://arxiv.org/pdf/1512.02325.pdf)
In our use-case, pre-trained Caffe model is used from chuanqi305 (https://github.com/chuanqi305/MobileNet-SSD), which was trained on PASCAL VOC dataset. This Caffe model has the accuracy of 72.7 mAP. Further, opencv3 is used for inference for this model. For inference purpose, we only used a bicycle (scooter), car, and bus classes from VOC dataset object categories.
For vehicle classification, the second approach employed is MobileNet-SSD for object detection. As mentioned above in the use-case, pre-trained Caffe model is used. This classifier has 20 classes, but for vehicle counting and classification we have only used the above-mentioned classes.
Finally, for vehicle counting and classification, SVM and HOG based vehicle classification or MobileNet-SSD object detection algorithms can be used to classify the vehicle class accurately. The application can then track and classify them with a reasonable accuracy.
Vehicle Counting
Vehicle counting is carried out using the virtual line method. This virtual line acts as a counter from which the count is updated. For each vehicle that enters into the frame and crosses the virtual line, the count is incremented. The classification and counting results are shown below, along with their counts.
The virtual line is a baseline that cuts the frame in two parts. In traffic, when the vehicles are close to each other, there is a risk to count two adjacent vehicles being counted as one, which reduces the accuracy of the solution. This shortcoming can be overcome by using an accurate object segmentation algorithm. These methods based on virtual line can effectively perform counting with traffic.
The vehicle counting and classification when integrated into an application, the following steps are followed:
- Draw a line on the input image. (Virtual line)
- Calculate the inner product of vector for checking vehicle object is in the range of line or not.
- Find the current and previous position value of an object with respect to the line. Map the status of each object.
- If the current and previous position value of vehicle object is not the same, then increment respective vehicle class counter. Otherwise, capture the next frame and go to step 2.
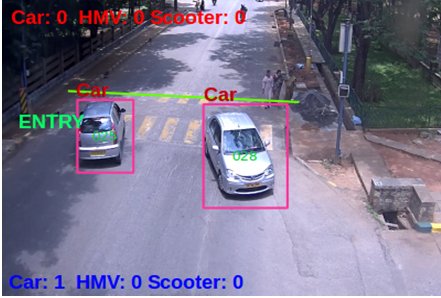
Fig [6]: Final image of Vehicle counting and classification
(Fig 6 shows the resultant image of Vehicle counting and classification. Increased count after the car passed the virtual line.)
Conclusion
The vehicle traffic data from this application can be used in real-time to count and classify vehicles on busy routes. Once this application is used to gather the data of vehicle types, a heat map can be generated to get different traffic flows and to help in better management of city traffic. This gives a quantified way to measure the vehicle traffic in the city. One such direct use would be to divert traffic for reducing the load on a particular choke point in the city. This kind of data can also be used to predict the wear and tear on the road and a maintenance schedule can be derived from it.
About Authors
Rajeev Thaware:
Rajeev Thaware us a Technical Manager at eInfochips, An Arrow Company. He has more than 17 years of experience in image processing and video content analysis. He has completed a Bachelor's degree in Electronics & Telecommunication Engineering from NIITK Surathkal.
Gouri Patil:
Gouri Patil works as an engineer at eInfochips-An Arrow Company. She has more than three years of experience in Video Analytics, specifically on security & surveillance, traffic management, and crowd management. Gouri holds a Bachelor's degree in Information Technology Engineering from Shivaji University, Kolhapur.
Saurabh Joshi:
Saurabh Joshi works as a Product Manager at eInfochips, focussing on product marketing for security & surveillance, industrial automation, automotive and retail practices. Saurabh has more than 9 years of rich experience in marketing solutions in the areas mentioned above. Saurabh holds an engineering degree along with an MBA from Tier-I institute.
About eInfochips:
eInfochips, an Arrow company, is a leading global provider of product engineering and semiconductor design services. With over 500+ products developed and 40M deployments in 140 countries, eInfochips continues to fuel technological innovations in multiple verticals. The company’s service offerings include digital transformation and connected IoT solutions across various cloud platforms, including AWS and Azure.
Along with Arrow’s $27B in revenues, 19,000 employees, and 345 locations serving over 80 countries, eInfochips is primed to accelerate connected products innovation for 150,000+ global clients. eInfochips acts as a catalyst to Arrow’s Sensor-to-Sunset initiative and offers complete edge-to-cloud capabilities for its clients through Arrow Connect.
References:
- https://ieeexplore.ieee.org/document/7177766
- https://towardsdatascience.com/vehicles-tracking-with-hog-and-linear-svm-c9f27eaf521a
- https://opencv-python-tutroals.readthedocs.io/en/latest/py_tutorials/py_ml/py_svm/py_svm_index.html
- https://docs.opencv.org/2.4/modules/gpu/doc/object_detection.html
- https://docs.opencv.org/3.1.0/d5/d33/structcv_1_1HOGDescriptor.html
