By Huw Geddes, Product Manager, Tessent, Siemens EDA
RISC-V processors are quickly becoming mainstream. The open standard means freedom for many developers, but success depends on the development of a support ecosystem around RISC-V. Industry collaboration is making broad adoption of RISC-V possible, and one example is the introduction of efficient trace for RISC-V cores.
To debug and profile a RISC-V processor that comprises tens or hundreds of cores and processes billions of instructions each second can be challenging. Is the software running as expected? Does the verification team see the same behavior as the firmware engineers or application developers? Are all the memory blocks being used efficiently? What’s causing hardware and software deadlocks in a system? How can an instruction be optimized? How can a random longtail problem that occurs intermittently be tracked down?
Software tools can provide some answers, but they often use system resources that affect how an application runs, which could cause irregular software behavior or require extensive instrumentation to capture the information needed to identify the root cause of a problem. SoC development teams are increasingly demanding that any RISC-V core includes a processor hardware trace solution that they can use to reconstruct exact instruction execution sequences when an event of interest happens in the device.
Hardware and software
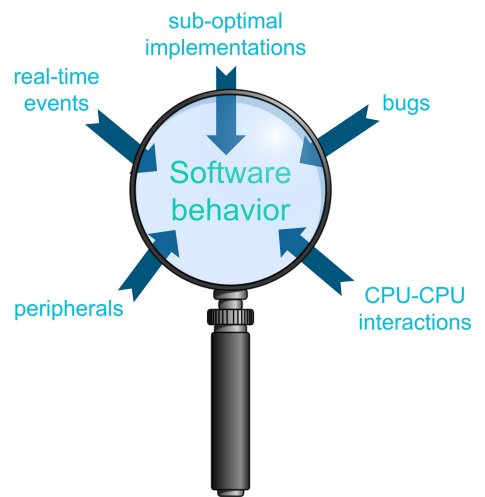
While software tools and processes remain the backbone for debugging and profiling tasks, they need the critical data captured by hardware modules closely integrated with system components to identify the root cause of a problem (figure 1). Collectively the hardware and software tools can provide a deterministic solution that captures accurate and robust data, sometimes over weeks or months, while avoiding the introduction of additional errors during verification, application development and testing. Critical issues can be investigated in real-time on or off chip, and the data captured by the hardware can be stored off-chip for further analysis, performance optimization and code coverage review.

Figure 1 – Processor trace lets you monitor program execution of a CPU in real time.
Efficient processor trace
Processor trace is a non-intrusive debugging technique which uses a hardware module to capture, encode and send off-chip a record of executed processor instructions, where software can reconstruct the exact execution sequence of a program. Instead of capturing every instruction possible, the Efficient Trace for RISC-V (E-Trace) standard uses Processor Branch Trace which reports a known start address within the program binary (ELF file) and then captures branches (jumps, calls, returns, interrupts or exceptions) and whether the branch is taken or not. All instructions that exist between branch instructions are assumed to execute sequentially and there is no need to report them. Processor branch trace can achieve very high compression, allowing more trace data can be captured and multiple cores to be traced simultaneously. The most efficient trace encoders with the highest compression also mean fewer requirements on the off-chip interface, so a less sophisticated interface IP can be used.
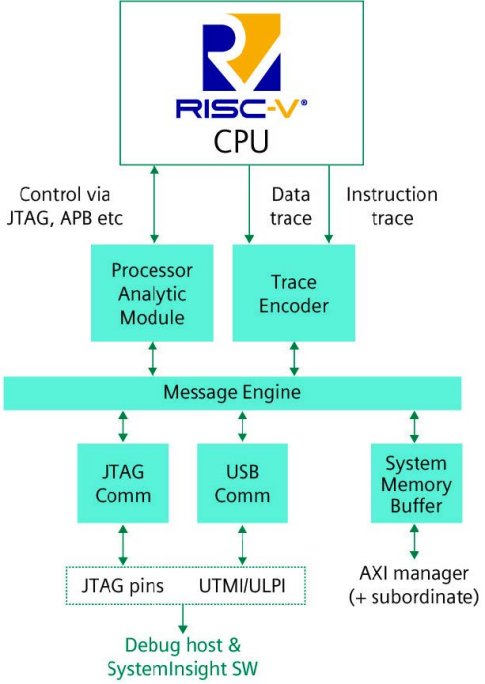
The Siemens RISC-V Enhanced Trace Encoder (figure 2) supports all the mandatory and optional features in the Efficient Trace for RISC-V (E-Trace) standard, plus a feature that is not yet part of the standard: cycle-accurate trace that reports the number of cycles of contiguously retired instructions followed by the number of cycles in which no instructions were retired.

Figure 2 – The Siemens’ Tessent Enhanced Trace Encoder is a fully-featured RISC-V trace solution.
Providing additional capabilities
Debugging a processor is not just about processor trace. A hardware analytics subsystem can include additional modules that communicate in real-time with each other, over a message fabric. For example, a processor module that manages the function calls from the host software (e.g., stop, start and breakpoints) can trigger the trace encoder to output trace data and instruct a direct memory access (DMA) module to read system memory values, when a transaction or event of interest occurs. The same hardware DMA module can also be used to significantly reduce the time taken to upload executable and linkable format (ELF) files and run new software iterations or enable the reset register.
Hardware counters provide an extremely efficient way to capture useful data such as the number of times an instruction is executed, or a function is called. Software functions like printf can be replaced by hardware macros embedded in the ELF file that take a few cycles to capture and output to host tools to decode and analyze using a Static Instrumentation module. These counters and macros can be used to provide extensive profiling information and performance indicators with minimal or no effect on the application behavior.
Summary
Adding hardware modules to a RISC-V design to support software debugging tools is essential, particularly for complex designs. While the additional area cost and verification requirements need to be considered early in the design phase, the benefits to embedded software engineers are significant. The data captured by the hardware can provide engineers with the information they need to understand how their applications run on the device under the most stringent real operating conditions.
The combination of hardware and software tools can reduce development time, improve processor and application performance, improve code coverage and reduce the critical time to market.
